
| Home : Map : Chapter 10 : Java : Tech : Physics : |
|
Generation & Analysis of Simulated Data
|
| JavaTech |
| Course Map |
| Chapter 10 |
| Supplements Performance Benchmarks |
| About
JavaTech Codes List Exercises Feedback References Resources Tips Topic Index Course Guide What's New |
|
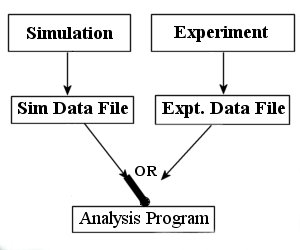
In Chapter 9: Phyiscs: Experimental Simulation with Analysis Module , the demonstration program combined data generation, animation, and analysis in one applet. For an actual experiment, however, it is important to use the same analysis for the real data as is used for the simulated data. So we would like to separate simulation and analysis into separate programs as shown in the following diagram:
As shown in figure 10.1, the analysis program receives data from either the simulated data or the actual experimental data. This insures that the algorithms and the code in the analysis program, which were developed with the simulated data, are consistently applied to the real data. The simulated data can be written to files that mimic those obtained from the experiment and typically include realistic detector features such as digitization offsets and varying slopes in analog to digital conversions.. This provides a check that the calibrations applied to the experimental data do in fact work as expected. (We will discuss this further in Chapter 11: Physics.) The demonstration programs on the following page illustrate this approach for the mass drop simulations discussed in Chapter 9: Physics.
References & Web Resources
Most recent update: Oct. 29, 2005 |
|
Tech |