|
Finding a function that fits a set of data is a common requirement
in the analysis of an experiment. The Least Squares Fit (LSF)
method leads to a set of equations that provide estimates of the
parameters of a function, such as the intercept and slope of a straight
line, to fit to a set of data. Furthermore, it provides error estimates
for these parameters.
The LSF begins with the definition of a chi-square function
as in .
chi2
= sumNi=1[ (yi - f(xi,
a1,a2,...aM)/ sigmai]2
for the case of a N
values of a single independent variable y
and a single dependent variable x.
(See, for example Press,
for a discussion of the derivation of the chi-square function from
maximum likelihood estimation.) Here yi
is to the measured value at dependent variable point xi
and f(xi,
a1,a2,...aM) is a function
of x with
M parameters.
The error on the yi
measurement is give by sigma.
which corresponds to the standard devivation value on the distribution
of yi measurements.
Minimizing the chi-square with respect to the parameters, as in
d(chi2)/daj
= 0, for j=1,..,M
will lead to a set of equations that can be solved for the parameters.
We will not derive the solutions for particular functions here.
See the references below or other numerical
analysis books for details.
For a straight line and errors sigmai;
y
= a + bx
results in (ref. Press)
a
= (SxxSy - SxSxy)/D
b = (SSxy - SxSy)/D
sigmaa2
= Sxx/D
sigmab2 = S/D
where
S
= sumNi=1[1/sigmai2]
Sx
= sumNi=1[xi/sigmai2]
Sy = sumNi=1[yi/sigmai2]
Sxy = sumNi=1[xi*yi/sigmai2]
Sxx = sumNi=1[xi*xi/sigmai2]
D
= SSxx - (Sx)2
The following applet generates "tracks" (lines between
left and right sides) and then selects points along the horzontal
axis to make vertical measurements of the tracks tracks. The user
can select a smearing factor (std.dev. of Gaussian) for the vertical
measurements. The program fits a track to the points using the above
formulas and plots it. Differences in the generated and fitted slope
and intercept values are displayed in two histograms. The third
histogram shows the distribution of the residuals (differences between
the fitted track values and the measured values).
This program uses a highly modular approach that brings a lot flexibility.
We will use the classes here in many progams in following chapters.
The following diagram highlights the main elements of the LsfLine_JApplet11
program:
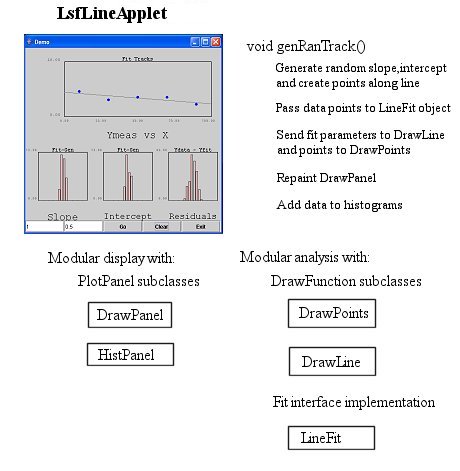
The method genRanTrack()
in class LsfLine_JApplet11
creates a random track and finds points along the track to simulate
measured values. It then fits these points using an instance of
the LineFit
class. The fit parameters and the points go to instances of the
DrawLine
and DrawPoints
classes, respectively. These two are both subclasses of DrawFunction.
The DrawPanel
loops through its array of DrawFunction
objects and invokes the draw()
method of each.
|
|
Java Notes
- Modularization and polymorphism are illustrated
again here by the use of the DrawFunction
objects and the Fit
base class and its subclass FitLine.
The program uses objects for all the primary activities
and allows for the classes to be re-uised in other programs.
|
|
import
javax.swing.*;
import java.awt.*;
import java.awt.event.*;
/**
*
* It generates points along a line
and then fits a
* straight line to them. This simulates
track fitting
* in a detector.
*
* The number of tracks and the SD
of
* the smearing of the track measurement
errors taken from
* entris in two text fields. Two
histograms record differences
* in the slope and intercept for
the fitted track with the
* generated track. A third histogram
holds the residuals.
*
* This program will run as an applet
inside
* an application frame.
*
* The "Go" button starts the track
generation and fitting in a
* thread. "Clear" button
clears the histograms.
* In standalone mode, the Exit button
closes the program.
*
**/
public class LsfLineApplet extends JApplet
implements ActionListener, Runnable
{
// Use the HistPanel JPanel subclass here
HistPanel fSlopePanel;
HistPanel fInterceptPanel;
HistPanel fResidualsPanel;
// Use a DrawPanel to display the points to
fit
DrawPanel fDrawPanel = null;
// Thee histograms to record differences between
// generated tracks and fitted tracks.
Histogram fSlopeHist;
Histogram fInterceptHist;
Histogram fResidualsHist;
// Use DrawFunction subclasses to plot on the
DrawPanel
DrawFunction [] fDrawFunctions;
// Set values for the tracks including the default
number
// of tracks to generate, the track area, the
SD smearing
// of the data points, and the x values where
the track
// y coordinates are measured.
int fNumTracks =
1;
double fYTrkMin = 0.0;
double fYTrkMax = 10.0;
double fXTrkMin = 0.0;
double fXTrkMax = 100.0;
double fTrkSmear = 0.5;
double [] fXTrk = {10.0,30.0,50.0,70.0,90.0};
double [] fYTrk = new double[5];
// Data array used to pass track points to DrawPoints
double [][] fData = new double[4][];
// Random number generator
java.util.Random fRan;
// Inputs for the number of tracks to generate
JTextField fNumTrksField;
// and the smearing of the tracking points.
JTextField fSmearField;
// Flag for whether the applet is in a browser
// or running via the main () below.
boolean fInBrowser = true;
//Buttons
JButton fGoButton;
JButton fClearButton;
JButton fExitButton;
// Use thread reference as flag.
Thread fThread;
/**
* Create a User Interface with histograms
and buttons to
* control the program. Two text
files hold number of tracks
* to be generated and the measurement
smearing.
**/
public void init () {
// Will need random number generator
for generating tracks
// and for smearing the measurement
points
fRan = new java.util.Random ();
// Create instances of DrawFunction
for use in DrawPanel
// to plot the tracks and the measured
points along them.
fDrawFunctions =
new DrawFunction[2];
fDrawFunctions[0] = new DrawLine
();
fDrawFunctions[1] = new DrawPoints
();
// Start building the GUI.
JPanel panel = new JPanel (new GridLayout
(2,1));
// Will plot the tracks on an instance
of DrawPanel.
fDrawPanel =
new DrawPanel (fYTrkMin,fYTrkMax,
fXTrkMin, fXTrkMax,
fDrawFunctions);
fDrawPanel.setTitle ("Fit Tracks");
fDrawPanel.setXLabel ("Ymeas vs
X");
panel.add (fDrawPanel);
// Create histograms to show the
quality of the fits.
fSlopeHist = new Histogram
("Fit-Gen","Slope", 20, -0.1,0.1);
fInterceptHist = new Histogram ("Fit-Gen","Intercept",
20, -5.,5.);
fResidualsHist = new
Histogram ("Ydata - Yfit","Residuals", 20, -3,3.);
// Use another panel to hold the
histogram and controls panels.
JPanel hist_crls_panel = new JPanel
(new BorderLayout ());
JPanel histsPanel = new JPanel (new
GridLayout (1,3));
histsPanel.add (fSlopePanel=new
HistPanel (fSlopeHist));
histsPanel.add (fInterceptPanel=new
HistPanel (fInterceptHist));
histsPanel.add (fResidualsPanel=new
HistPanel (fResidualsHist));
// Add the panel of histograms to
the main panel
hist_crls_panel.add (histsPanel);
// Use a textfield for an input
parameter.
fNumTrksField =
new JTextField (Integer.toString
(fNumTracks), 10);
// Use a textfield for an input
parameter.
fSmearField =
new JTextField (Double.toString
(fTrkSmear), 10);
// If return hit after entering
text, the
// actionPerformed will be invoked.
fNumTrksField.addActionListener
(this);
fSmearField.addActionListener (this);
fGoButton = new JButton ("Go");
fGoButton.addActionListener (this);
fClearButton = new JButton ("Clear");
fClearButton.addActionListener (this);
fExitButton = new JButton ("Exit");
fExitButton.addActionListener (this);
JPanel control_panel = new JPanel
(new GridLayout (1,5));
control_panel.add (fNumTrksField);
control_panel.add (fSmearField);
control_panel.add (fGoButton);
control_panel.add (fClearButton);
control_panel.add (fExitButton);
if (fInBrowser) fExitButton.setEnabled
(false);
hist_crls_panel.add (control_panel,"South");
panel.add (hist_crls_panel);
// Add text area with scrolling
to the applet.
add (panel);
} // init
public void actionPerformed (ActionEvent e) {
Object source = e.getSource ();
if ( source == fGoButton || source
== fNumTrksField
|| source == fSmearField )
{
String strNumDataPoints
= fNumTrksField.getText ();
String strTrkSmear =
fSmearField.getText ();
try {
fNumTracks
= Integer.parseInt (strNumDataPoints);
fTrkSmear
= Double.parseDouble (strTrkSmear);
}
catch (NumberFormatException
ex) {
// Could
open an error dialog here but just
// display
a message on the browser status line.
showStatus
("Bad input value");
return;
}
fGoButton.setEnabled
(false);
fClearButton.setEnabled
(false);
if (fThread != null)
stop ();
fThread = new Thread
(this);
fThread.start ();
}
else if (source == fClearButton)
{
fSlopeHist.clear
();
fInterceptHist.clear
();
fResidualsHist.clear
();
repaint
();
}
else if (!fInBrowser)
System.exit
(0);
} // actionPerformed
/** Stop thread by setting reference to null.
This stops
* loop in run()
**/
public void stop (){
// If thread is still running, setting
this
// flag will kill it.
fThread = null;
} // stop
/** Generate the tracks in a thread. */
public void run (){
for (int i=0; i < fNumTracks; i++){
// Stop the thread if
flag set
if (fThread == null)
return;
// Generate a random
track.
double [] genParams
= genRanTrack (fXTrkMax-fXTrkMin,
fYTrkMax-fYTrkMin,
fXTrk,
fYTrk, fTrkSmear);
// Fit points to a straight
line. Use constant error.
double [] fitParams
= new double[4];
FitLine.fit (fitParams,
fXTrk, fYTrk, null, null, fXTrk.length);
// Pass the parameters
to the straight line fit.
fDrawFunctions[0].setParameters
(fitParams,null);
// Pass the data points
to the DrawPoints object via
// the 2-D array.
fDrawFunctions[1].setParameters
(null, fData);
// Redrawing the panel
will cause the paintContents (Graphics g)
// method in DrawPanel
to invoke the draw () method for the line
// and points drawing
functions.
fDrawPanel.repaint ();
// Add fit measurement
values to the respective histograms.
fInterceptHist.add (fitParams[0]-genParams[0]);
fSlopeHist.add (fitParams[1]-genParams[1]);
// Include residuals
== difference between the measured value
// and the fitted value
at the points at each x position
for (int j=0; j < fXTrk.length;
j++){
double
y = fitParams[0] + fitParams[1]*fXTrk[j];
fResidualsHist.add
(fYTrk[j] - y);
}
// Pause briefly to
let users see the track.
try
{
Thread.sleep
(30);
}
catch (InterruptedException
e){}
}
repaint ();
fGoButton.setEnabled (true);
fClearButton.setEnabled (true);
} // run
/**
* Generate a track and
obtain points along the track.
* Smear the vertical
coordinate with a Gaussian.
**/
double [] genRanTrack (double xRange, double
yRange,
double [] xTrack,double [] yTrack,
double smear) {
// Line intercept and slope values
in array.
double [] lineParam = new double[2];
// Simulated tracks for creating
the desired distibution.
double y0 = yRange * fRan.nextDouble
();
double y1 = yRange * fRan.nextDouble
();
lineParam[1] = (y1-y0)/xRange;
for (int i=0; i < xTrack.length;
i++){
yTrack[i] = y0 + lineParam[1]*xTrack[i];
yTrack[i] += smear*fRan.nextGaussian
();
}
// Set up the parameters in the
drawing function.
lineParam[0] = y0; //intercept
fDrawFunctions[0].setParameters
(lineParam,null);
// The LineFit function will need
this data via
// a 2-D array.
fData[0] = yTrack;
fData[1] = xTrack;
fData[2] = null;
fData[3] = null;
// Return the track parameters.
return lineParam;
} // genRanTrack
/**
* Allow for option of
running the program in standalone mode.
* Create the applet and
add to a frame.
**/
public static void main (String[] args) {
//
int frame_width=450;
int frame_height=450;
//
LsfLineApplet applet = new LsfLineApplet
();
applet.fInBrowser = false;
applet.init ();
// Following anonymous class used
to close window & exit program
JFrame f = new JFrame ("Demo");
f.setDefaultCloseOperation (JFrame.EXIT_ON_CLOSE);
// Add applet to the frame
f.getContentPane ().add ( applet);
f.setSize (new Dimension (frame_width,frame_height));
f.setVisible (true);
} // main
} // LsfLineApplet
|
|
import
java.awt.*;
/**
* Fit straight line to a set of data
points.
* Implements the Fit interface.
*
**/
public class FitLine extends Fit
{
/**
* Use the Least Squares
fit method for fitting a
* straight line to 2-D
data for measurements
* y[i] vs. dependent
variable x[i]. This fit assumes
* there are errors only
on the y measuresments as
* given by the sigma_y
array.
* See, e.g. Press et
al., "Numerical Recipes..." for details
* of the algorithm.
**/
public static void fit (double [] parameters,
double [] x, double [] y,
double [] sigma_x, double [] sigma_y, int num_points){
double s=0.0,sx=0.0,sy=0.0,sxx=0.0,sxy=0.0,
del;
// Null sigma_y implies a constant
error which drops
// out of the divisions of the sums.
if (sigma_y != null){
for (int
i=0; i < num_points; i++){
s
+= 1.0/ (sigma_y[i]*sigma_y[i]);
sx +=
x[i]/ (sigma_y[i]*sigma_y[i]);
sy +=
y[i]/ (sigma_y[i]*sigma_y[i]);
sxx
+= (x[i]*x[i])/ (sigma_y[i]*sigma_y[i]);
sxy
+= (x[i]*y[i])/ (sigma_y[i]*sigma_y[i]);
}
} else {
s = x.length;
for (int
i=0; i < num_points; i++){
sx +=
x[i];
sy +=
y[i];
sxx
+= x[i]*x[i];
sxy
+= x[i]*y[i];
}
}
del = s*sxx - sx*sx;
// Intercept
parameters[0] = (sxx*sy
-sx*sxy)/del;
// Slope
parameters[1] = (s*sxy
-sx*sy)/del;
// Errors (sd**2) on
the:
// intercept
parameters[2] = sxx/del;
// and slope
parameters[3] = s/del;
} // fit
} // FitLine
|
import java.awt.*;
/** Interface for algorithms to fit 2-D data points. */
public class Fit
{
/**
* Returns an array with
the fit parameters, e.g.
* slope and intercept for
a straight line, to 2-D
* data.
**/
public static void fit (double [] parameters,
double [] x, double [] y,
double [] sigma_x, double [] sigma_y, int num_points) {};
} // Fit |
References
& Web Resources
Last update: Feb.27.04
|
