|
In our first demonstration
program of this chapter, the "analysis" consisted of a
histogram of the acceleration values and the code for this lay inside
the applet class. Similarly, for the experiment
demonstration, which included a simulated detector, the analysis
consisted merely of calculating the acceleration from the detector
"measurements" and displaying the values in a histogram.
As before, the analysis code remained in the applet.
In our simple falling mass demonstration program,
we separate the analysis code into its own class. The program uses
many of the same classes as in the previous experiment
simulation but we put the analysis into a class called DropAnalysis.
It includes all of the calculation code and displays the results
in its own panel.
Note: In Chapter
10: Phyiscs: Generation & Analysis of Simulated Data ,
we continue from this example by separating the data generation
from the analysis. Simulated data is written to a file by the
generator for each run. The data is read by the analysis programs.
In a real world experiment, the same analysis program would run
on the real data files, which should have the same format as the
simulated data.
We create the DropAnalysis
object in the applet and display its panel on the applet's planel.
However, DropAnalysis
could easily go into its own application program and operate on
data files rather than getting the data directly from the simulator
as done here in the applet. These options are left as exercises.
The applet differs from the previous
demo by measuring the positions of the mass at fixed intervals
in time from the start of the drop rather than measuring the times
at fixed positions. This simulates the common undergraduate lab
experiments that use a spark chart setup. The ball drops and a high
voltage applied every DT
time interval causes a spark to the ball that leaves a mark
on a strip of paper. For a each time period after the drop starts,
the plot averages the position measurements over N runs. The error
bars come from the standard deviation to these distributions. A
fit to a polynominal
y
= c + b*T + a*T2
determines the gravitational acceleration using g=
a*2.0.
|
DropTestAnalysisApplet
- simulate a experiment in which a dropped ball leaves
marks every DT interval, as in a spark chart experiment.
Include fitting of data points to represent the analysis
of the experiment. The code is modularized with several
other classes listed here:
+ New classes:
DropAnalyzer.java
- analyzes data from a single run and from a set of
runs. Plots averaged measured position vs. time during
the drop and fits to a quadratic to determing the acceleration
constant. Includes its on panel for its plot and output.
So could be included in another program, such as one
to analyzed actual experiment data.
DropDetector2.java
- an implementation of Detector. This class simulates
a detector that measures the position of the dropped
mass every DT time interval. This could represent, for
example, the common spark chart type of detector used
in introductory physics experiments. The class also
will draw the detector on the instance of DropPanelDetect.
+ Previous classes:
Ch. 9:
Physics:
DropPanelDetect.java,
DropModelDetect.java,
Detector.java
Ch.
8: Physics:
Fit.java,
FitPoly.java,
DrawPoly.java
Ch.
6: Tech:
DrawPanel.java,
DrawPoints.java,
DrawFunction.java
Ch.
6: Tech: PlotPanel.java,
PlotFormat.java
|
The path of the dropping ball is now marked by circles indicating
the position of the ball after each DT
step. This is similar to the marks on the paper in a spark chart
setup.
Examine the diagram in figure 9.5 to see the process followed by
the program.
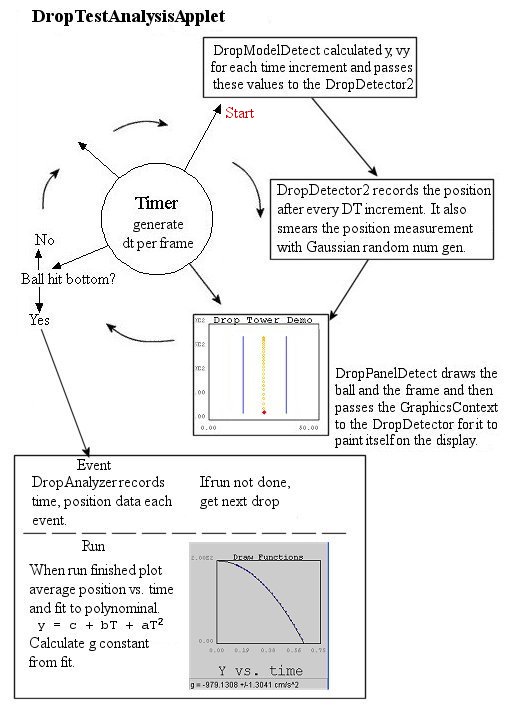
Figure Phy.9.5: Similar sequence as in Figure
Phy.9.3 but with the DropAnalyzer
class added. For each step in the simulation of the fall
by DropModelDetect,
the DropDetector2
object is called and it records the position for each DT
increment.. The detector also paints itself on the animation
frame. When the drop finishes, the DropAnalyzer
object gets the drop data arrays (times and positions along
the drop). At the end of the set of drops (i.e. the "run"),
the analyser calculates the average position for each DT
time step and plots Y vs Time. A fit to this plot with a
polynominal gives a measure of the gravitational acceleration
constant.
Note that the DrawPanel
uses instances of DrawPoints
and DrawPoly
classes to make the plot.
This set of classes provides a highly modular approach to the simulation
and analysis that allows for great flexibility. For example, you
can add additional capabilities to each class, such as drag effects
to the drop model or additional plots in the analysis class, without
affecting the other parts.
| DropTestAnalysisApplet |
|
import
javax.swing.*;
import java.awt.*;
import java.awt.event.*;
/**
* This program simulates an experiment in which
measurements
* are made during the fall of a mass in a constant
gravitational
* field that will be used to determine the acceleration
constant.
* It illustrates the basic components involved
with a simulation
* of any physics experiment.
*
* The applet uses DropPanelDetect to display
the experiment setup
* and the falling mass. The DropDetector object
draws the detector
* on this panel.
*
* Data for each drop is passed to an instance
of DropAnalyzer,
* which saves the data. At the end of the run (a
set of drops),
* the analyzer plots Yaverage vs. Time and fits
the points to
* a polynominal c + bT + cT^2. From the c coefficient
the gravitational
* value can be determined.
*
* The java.util.Timer and java.util.TimerTask
are used
* to update the animation of the drop.
*
* Includes "Drop" button to initiate the dropping.
*
*
* The number of drops and a speed factor taken
from 2 text fields.
* "Reset" button clears the histogram.
* In standalone mode, the Exit button closes
the program.
*
*
* This program will run as an applet inside
* an application frame.
*
**/
public class DropTestAnalysisApplet extends JApplet
implements ActionListener
{
// The DropPanel displays the animation of the
// falling mass.
DropPanelDetect fDropPanel;
// The DropModel generates the physics data.
DropModelDetect fDropModel;
// The DropAnalyzer examines the data.
DropAnalyzer fDropAnalyzer;
// Use a detector to measure the drop times.
Detector fDetector;
// Use the java.util Timer and TimerTask combo
// for timing events.
java.util.Timer fTimer;
// A text field for getting number of drops
per
// run and the position smearing std.dev. in
cm.
JTextField fMaxNumDropsField;
JTextField fPosSigmaFactorField;
// Flag for whether the applet is in a browser
// or running via the main () below.
boolean fInBrowser = true;
//Buttons
JButton fGoButton; // start drop
JButton fClearButton;// resets histogram
JButton fExitButton;
// Starting coordinates of drop
double fXBallStart = 25.0; // cm
double fYBallStart = 200.0; // cm
double fYBallEnd = 0.0;
// cm
// Range of the drop time.
double fTStart = 0.00; // sec
double fTEnd = 0.75; // sec
// SD in the measured values for the marker
positions and t (sec).
// (Allow for smearing of marker
position for further experimentation.)
double [] fMeasurementSigmas = { 2.0,
0.0};
// Integer and double arrays to pass info to
the detector
int [] fDetectorSetup;
double [] fDetectorParameters;
// Coordinate of ball.
double fXBall;
double fYBall;
// Initial velocity.
double fVyBallStart = 0.0;
double fVxBallStart = 0.0;
// Time in millisecs for the drop
double fTDropTotal;
double fTFrame = 0.020; // in secs
// Speed up or slow down factor for animation:
double fTFactor = 1.0;
// Allow for multiple drops per "run"
int fMaxNumDrops = 10;
int fNumDrops = 0;
// Number of times to measure the position during
the drop.
int fMaxNumMeasurements = 40;
/**
* Initialize the display.
Create Detector and Model
* objects to use for
the physics and experiment simulation.
* DropPanelDetect displays
the dropping ball and the
* detector. Add a analysis
panel to display the data.
**/
public void init () {
// Create a detector
fDetector = new DropDetector2 ();
// Need arrays to pass setup info
to the detector.
fDetectorSetup = new int[1];
fDetectorSetup[0] = fMaxNumMeasurements;
// Do a measurement for every frame
fDetectorParameters = new double[1];
fDetectorParameters[0] = fTFrame;
// Pass the detector the necesary
setup info
fDetector.init (fDetectorSetup,
fDetectorParameters, fMeasurementSigmas);
// Create the drop physics model
fDropModel = new DropModelDetect
(fDetector);
fDropModel.reset (fYBallStart, fVyBallStart);
// Create the analyzer
fDropAnalyzer = new DropAnalyzer
(fYBallEnd, fYBallStart,
fTStart,
fTEnd);
JPanel panel = new JPanel (new BorderLayout
());
// Use a textfield to get the number
of drops per run.
fMaxNumDropsField =
new JTextField (Integer.toString
(fMaxNumDrops), 10);
// Use a textfield to get smearing (std.dev.
in cm) of the position.
fPosSigmaFactorField =
new JTextField (Double.toString
(fMeasurementSigmas[0]), 10);
// If return hit after entering
text, the
// actionPerformed will be invoked.
fMaxNumDropsField.addActionListener
(this);
fPosSigmaFactorField.addActionListener
(this);
fGoButton = new JButton ("Drop");
fGoButton.addActionListener (this);
// Here the clear button will reset
the plots
fClearButton = new JButton ("Reset");
fClearButton.addActionListener (this);
fExitButton = new JButton ("Exit");
fExitButton.addActionListener (this);
JPanel control_panel = new JPanel
(new GridLayout (1,2));
JPanel panel1 = new JPanel (new
GridLayout (1,2));
JPanel panel2 = new JPanel (new
GridLayout (1,3));
panel1.add (fMaxNumDropsField);
panel1.add (fPosSigmaFactorField);
panel2.add (fGoButton);
panel2.add (fClearButton);
panel2.add (fExitButton);
control_panel.add (panel1);
control_panel.add (panel2);
// Create an instance of the DropPanel
// Make the panel 10% taller than
starting position.
fDropPanel = new DropPanelDetect
(fYBallStart*1.1, 0.0, fDetector);
// Get the DrawPanel from the analyzer
JPanel analyzePanel = fDropAnalyzer.getPanel
();
JPanel holder_panel = new JPanel
(new GridLayout (1,2));
holder_panel.add (fDropPanel);
holder_panel.add (analyzePanel);
panel.add (holder_panel,"Center");
panel.add (control_panel,"South");
// Add text area with scrolling
to the content pane.
add (panel);
} // init
/** Stop the timer if the browser page unloaded.
*/
public void stop () {
runDone ();
} // stop
/**
* Respond to the buttons.
For a click on "Drop" button,
* execute the number
of drops in the text field.
* Also, obtain the smearing
factor for the y measurements
* from the other text
field. The Reset button will clear the
* plots and reset the
drop stats.
**/
public void actionPerformed (ActionEvent e)
{
Object source = e.getSource ();
if (source == fGoButton) {
if (fGoButton.getText
().equals ("Drop")) {
try {
fMaxNumDrops
=
Integer.parseInt
(fMaxNumDropsField.getText ());
//
Get new sigma for position smearing
fMeasurementSigmas[0]
=
Double.parseDouble
(fPosSigmaFactorField.getText ());
//
Update the position smearing
fDetector.init
(fDetectorSetup, fDetectorParameters,
fMeasurementSigmas);
}
catch (NumberFormatException
ex) {
//
Could open an error dialog here but just
//
display a message on the browser status line.
if
( fInBrowser)
showStatus
("Bad input value");
else
System.out.println
("Bad input value");
return;
}
dropReset
();
fGoButton.setText
("Stop");
fClearButton.setEnabled
(false);
} else {
//
Stop without finishing the current drop.
runDone
();
}
} else if (source == fClearButton)
{
fDropAnalyzer.reset
();
repaint
();
} else if (!fInBrowser)
System.exit
(0);
} // actionPerformed
/**
* Use the inner class technique
to define the
* TimerTask subclass for stepping
through the
* drop calculation and the frame
refresh.
* Use the real time in the drop
calculation instead
* of the given frame rate times
in case there were
* delays from thread interruptions,
the processing
* in the parts of the program take
extra time, etc.
**/
class PaintHistTask extends java.util.TimerTask
{
public void run () {
// Drop the ball
fYBall = fDropModel.step
(fTFactor * fTFrame);
// Update the position
of the ball in the
// animation and redraw
the frame.
fDropPanel.updatePosition
(fXBall, fYBall);
// Check if ball has
crossed the finish line.
if ( fYBall <= fYBallEnd)
dropDone ();
} // run
} // PaintHistTask
/**
* Before each set of
drops, need to create a new timer,
* and set up its schedule.
The PaintHistTask innner class
* object will do the
setup for each frame of a drop animation.
**/
void dropReset () {
// Before starting the drop, create
the timer task
// that will cause the histogram
display to update
// during the filling.
// Create a timer. TimerTask created
in MakeHist ()
fTimer = new java.util.Timer ();
fDropModel.reset (fYBallStart, fVyBallStart);
fDropPanel.reset (fXBallStart, fYBallStart);
// Reset time sum
fTDropTotal = 0.0;
fNumDrops = 0;
fYBall = fYBallStart;
fXBall = fXBallStart;
// Tell the analyzer how many drops
will be made and how many
// measurements per drop.
fDropAnalyzer.initRun (fMaxNumDrops,
fMaxNumMeasurements);
// Reset the detector.
fDetector.reset ();
repaint ();
// Start the timer after 20ms and
then repeat calls
// to run in PaintHistTask object
by the rate set by
// the fTFrame value.
fTimer.schedule (new PaintHistTask
(), 20, (int) (fTFrame*1000));
} // dropReset
/**
* Invoked after a drop
ends bottom. Reset
* all the parameters
to set up for another drop.
**/
public void dropDone () {
// Get the data (times
and positions during the drop)
// from the detector and analyze
it
double data[][] = fDetector.getResults
();
int numMeasures = fDetector.getNumMeasurements
();
fDropAnalyzer.analyzeDrop (data[0],
data[1], numMeasures);
++fNumDrops;
// Check if all drops completed.
if (fNumDrops == fMaxNumDrops){
// If so then finish
up the data recording
// for this run and
return.
runDone ();
return;
}
// Reset time sum
fTDropTotal = 0.0;
fYBall = fYBallStart;
fXBall = fXBallStart;
fDropPanel.reset (fXBallStart, fYBallStart);
fDropModel.reset (fYBallStart, fVyBallStart);
fDetector.reset ();
} // dropDone
/**
* Invoked when all the
drops in a run (set of drops) are done.
* Kills the timer to
stop the animation. (A new timer will be
* created in the dropReset
() for the next run.)
* Tell the DropAnalyser
instance to do its job on the run data.
**/
public void runDone () {
// Stop the animation.
fTimer.cancel ();
// Update histogram
fDropAnalyzer.analyzeRun ();
// Reset the buttons.
fGoButton.setText ("Drop");
fClearButton.setEnabled (true);
} // runDone
/** Offer the option of running the applet in
an app frame. */
public static void main (String[] args) {
//
int frame_width=450;
int frame_height=300;
//
DropTestAnalysisApplet applet =
new DropTestAnalysisApplet ();
applet.fInBrowser = false;
applet.init ();
// Following anonymous class used
to close window & exit program
JFrame f = new JFrame ("Drop Test");
f.setDefaultCloseOperation (JFrame.EXIT_ON_CLOSE);
// Add applet to the frame
f.getContentPane ().add ( applet);
f.setSize (new Dimension (frame_width,frame_height));
f.setVisible (true);
} // main
} // DropTestAnalysisApplet
|
| DropAnalyzer
|
import
java.awt.*;
import javax.swing.*;
/**
* This class carries out the analysis
of the
* drop experiment. It would work with
either
* simulated or "real" data.
**/
public class DropAnalyzer
{
// These DrawFunction objects will draw data and
fitted
// curves on the DrawPanel instance.
DrawPoly fDrawPoly;
DrawPoints fDrawPoints;
// Panel and components for displaying analysis
results
JPanel fAnalysisPanel;
DrawPanel fDrawPanel;
JTextField fResultsField;
// Drop accounting
int fNumDrops = 0;
int fMaxNumDrops = 1;
int fMaxNumMeasurements = 10;
int fNumMeasurements = 10;
DrawFunction [] fDrawFunctions;
// Data array to recorded position data
// for each drop.
double [][] fDyData;
// Drop times assumed same in each drop.
double [] fDtData;
// Array for passing data to DrawPoints object.
double [][] fPointsData = new double[4][];
/**
* The constructor receives
the limits to the
* vertical range of the
drop and the times.
**/
public DropAnalyzer (double y_data_min, double
y_data_max,
double t_data_min, double t_data_max){
// Create the DrawFunctions for passing
to the
// instance of DrawPanel.
fDrawPoly = new DrawPoly
();
fDrawPoints = new DrawPoints ();
fDrawFunctions = new DrawFunction[2];
fDrawFunctions[0] = fDrawPoints;
fDrawFunctions[1] = fDrawPoly;
// Build the display panel and its
components
// Create an instance of DrawPanel.
The GUI program
// using this class can obtain a reference
to the fDrawPanel
// via the getPanel () method.
fDrawPanel =
new DrawPanel (y_data_min,
y_data_max,
t_data_min,
t_data_max,
fDrawFunctions);
fDrawPanel.setXLabel ("y vs. time");
fDrawPanel.setTitle ("Data Fit");
fResultsField = new JTextField ("Expt.
results");
fResultsField.setEditable (false);
fAnalysisPanel = new JPanel (new BorderLayout
());
fAnalysisPanel.add (fDrawPanel, "Center");
fAnalysisPanel.add (fResultsField,
"South");
} // DropAnalyzer
/**
* Get the data measurements
from the detector for a
* single drop. The time
and positions are recorded from
* the first measurement
point. The arrays may not be full
* so the fNumMeasurements
variable keeps track of the number
* of elements with data.
**/
public void analyzeDrop (double [] measured_pos,
double [] measured_times,
int n_measures ){
// Restrict the number drops to the
fixed size of the data array.
if (fNumDrops >= fMaxNumDrops ) return;
// Use the given number of elements
in the array but don't exceed
// the size of the fDyData.
fNumMeasurements = n_measures;
if (fNumMeasurements > fMaxNumMeasurements)
fNumMeasurements
= fMaxNumMeasurements;
// Make sure that the buffer size
equals that of the time data array
if (fDtData == null || fDtData.length
< n_measures)
fDtData =
new double[fNumMeasurements];
for (int j=0; j < fNumMeasurements;
j++){
// Save the
time data. Assume it does not change
// significantly
from drop to drop.
fDtData[j]
= measured_times[j];
// Record
the position data for every drop so that
// we can
do averaging and error calculations at the
// end of
the run.
fDyData[fNumDrops][j]
= measured_pos[j];
}
fNumDrops++;
} // analyzeDrop
/**
* Let top class get access
to panel with the components
* showing the analysis
results.
**/
public JPanel getPanel () {
return fAnalysisPanel;
} // getPanel
/**
* Analyze the data from
a set of drops.
* Find the average position
at each time step.
* Also calculate the sigma
on the position.
**/
public void analyzeRun () {
if (fNumDrops == 0) return;
// Create the arrays needed for the
averaging
// and std.dev. calculation.
double [] dyAvg = new double[fNumMeasurements];
double [] dySq = new double[fNumMeasurements];
double [] sigmaY = new double[fNumMeasurements];
// Accumulate the sums for the averaging
for (int i=0; i < fNumDrops; i++)
{
for (int j=0; j < fNumMeasurements;
j++){
dyAvg[j]
+= fDyData[i][j];
dySq[j] +=
fDyData[i][j] * fDyData[i][j];
}
}
// Get the average position and its
std.dev.
for (int j=0; j < fNumMeasurements;
j++){
// Get the average velocity
over the top gap
dyAvg[j] /= fNumDrops;
dySq[j] /=
fNumDrops;
// Calculate the std.dev.
double err = dySq[j] -
dyAvg[j]*dyAvg[j];
// Roundoff might result
in a neg value for case of
// very small
or zero smearing of the position data.
if ( err < 1.0E-10)
sigmaY[j]=0.0;
else
sigmaY[j]
= Math.sqrt (err);
}
fPointsData[0] = dyAvg;
fPointsData[1] = fDtData;
fPointsData[2] = sigmaY;
fPointsData[3] = null; //
assume no error on the time values
// Pass the data points info to the
fDrawPoints object
fDrawPoints.setParameters ( null,
fPointsData);
// Fit points to a quadratic. Make
parameters array twice as big
// to make room for error values.
double [] parameters = new double[6];
FitPoly.fit (parameters, fDtData,
dyAvg, null, sigmaY, fNumMeasurements);
// Pass the fitted parameters to the
DrawPoly object to draw the
// quadratic.
fDrawPoly.setParameters (parameters,
null);
// Use the PlotFormat static method
to format the acceleration constant
// and its error (FitPoly
uses the covariance matrix diagonal elements
// to estimate the parameter errors.)
double g = parameters[2]*2.0;
double g_err = parameters[5]*2.0;
fResultsField.setText (
"g = "+
PlotFormat.getFormatted
(g,1100.0,0.0,4) +
" +/-" +
PlotFormat.getFormatted
(g_err,1100.0,0.0,4) +
" cm/s^2");
// Cause the curve to be
redrawn.
fDrawPanel.repaint ();
} // analyzeRun
/**
* Before each experiment (i.e.
set of drops), indicate here the number
* of measurements per drop
and the maximum number of drops per run.
**/
public void initRun (int max_drops, int max_num_measurements)
{
fMaxNumMeasurements = max_num_measurements;
fNumMeasurements = max_num_measurements;
fMaxNumDrops = max_drops;
// Create the data buffers.
if (fDyData == null || fDyData.length
< fMaxNumDrops)
fDyData = new double[fMaxNumDrops][fMaxNumMeasurements];
reset ();
} // initRun
/**
* Data accumulated or stored
elsewhere and passed
* here for analysis.
**/
public void setData (double [][] pos_data, double[]
time_data) {
fMaxNumDrops = pos_data.length;
fNumMeasurements = time_data.length;
fMaxNumMeasurements = time_data.length;
fDyData = pos_data;
fDtData = time_data;
} // setData
/** Reset parameters and clear the DrawPanel instance.
**/
public void reset () {
fNumDrops = 0;
fNumMeasurements = fMaxNumMeasurements;
// Clear the DrawFunction parameters
to prevent drawing
// on the panel
fDrawPoly.setParameters (null,null);
fPointsData[0] = null;
fPointsData[1] = null;
fPointsData[2] = null;
fPointsData[3] = null;
fDrawPoints.setParameters (null,fPointsData);
fResultsField.setText ("");
} // reset
/**
* Change the limits on the ranges
of the position and
* time data
**/
void setScaleLimits (double y_data_min, double
y_data_max,
double
t_data_min, double t_data_max) {
fDrawPanel.setScaleLimits (y_data_min,
y_data_max,
t_data_min, t_data_max);
} // setScaleLimits
} // DropAnalyzer |
| DropDetector2
|
import
java.awt.*;
/**
* This class simulates a detector measuring
the
* the position of a mass drops. Could
be a spark
* strip recorder for example.
**/
public class DropDetector2 implements Detector
{
// Error on the position measurements.
double [] fSigmas;
double [] fTimes;
double [] fPositions;
double fDetectTime; // Time in detector sensitive
region
double fTimeStep; // Time between measurements
int fMaxNumMeasurements = 1;
int fNumMeasurements =
0;
double [][] data = new double[2][];;
// Sensitive region limits
double fYTopLimit = 190.0; //cm
double fYBotLimit = 10.0;
//cm
double fXLeftLimit = 15.0;
//cm
double fXRightLimit = 35.0; //cm
// Create an instance of the Random class for
// producing our random values.
static java.util.Random fRan = new java.util.Random
();
/**
* Setup the detector. Parameters
argument not used.
*
* @param fSigmas - fSigmas
array gives the error on each measurement
* of position and time.
**/
public void init (int[] setup, double [] parameters,
double [] sigmas) {
// Get the S.D. for the time and
position values.
fSigmas = sigmas;
fTimeStep = parameters[0];
fDetectTime = 0.0;
if (fMaxNumMeasurements != setup[0]
|| fTimes == null){
fMaxNumMeasurements
= setup[0];
fPositions
= new double[fMaxNumMeasurements];
fTimes =
new double[fMaxNumMeasurements];
}
data[0] = fPositions;
data[1] = fTimes;
reset ();
} //init
/** Initialize for each drop. **/
public void reset (){
fNumMeasurements = 0;
fDetectTime = 0.0;
for (int i=0; i < fMaxNumMeasurements;
i++) {
fPositions[i] = 0.0;
fTimes[i] = 0.0;
}
} // reset
/**
* For the y and accumulated
drop time, obtain the
* simulated measured time
by a Gaussian smearing.
* @param vals - 2 element
array with the y and time values.
*
**/
public void measure (double [] vals) {
if (fNumMeasurements >= fMaxNumMeasurements)
return;
double time = vals[1];
// Wait for measurement to cross threshold
marker.
if (time >= fDetectTime) {
// Set new time threshold
fDetectTime = fNumMeasurements
* fTimeStep;
// Only record points
in the sensitive area.
if (vals[0] > fYTopLimit
|| vals[0] < fYBotLimit) return;
// Smear position by he
given sigma
fPositions[fNumMeasurements]
= vals[0] +
fSigmas[0]
* fRan.nextGaussian ();
// Can smear time as well.
fTimes[fNumMeasurements++]
= vals[1] +
fSigmas[1]
* fRan.nextGaussian ();
}
} // measure
/** Return the position and time arrays with a
single 2D array. **/
public double [][] getResults (){
return data;
} // getResults
/**
* Number of measured points can be
less than the
* maximum. So need access to this
value.
**/
public int getNumMeasurements () {
return fNumMeasurements;
}
/**
* Draw the detector markers
as horizonatal lines.
* Also draw some vertical
lines it indicate a drop
* area.
**/
public void draw (Graphics g, int x0, int y0,
int dx, int dy,
double x_convert, double y_convert) {
Color orig_color = g.getColor ();
g.setColor (Color.BLUE);
// Draw the vertical sides of detector
int xSideLeft = x0 + (int)
(fXLeftLimit * x_convert);
int xSideRite = x0 + (int)
(fXRightLimit * x_convert);
int yBot =
y0 + dy - (int) (fYBotLimit * y_convert);
int yTop =
y0 + dy - (int) (fYTopLimit * y_convert);
g.drawLine (xSideLeft,yTop,xSideLeft,yBot);
g.drawLine (xSideRite,yTop,xSideRite,yBot);
// Draw the ball at the points where
it is measured.
g.setColor (Color.ORANGE);
int xMark =
x0 + (int) (0.48 * dx);
int markWidth = (int) (0.04
* dx);
int markHeight = (int) (0.04 * dx);
for (int i=0; i < fNumMeasurements;
i++){
int yMark = y0 + dy - (int)
(fPositions[i]*y_convert);
g.drawOval (xMark,yMark,markWidth,markHeight);
}
// Return to previous color.
g.setColor (orig_color);
} // draw
} // DropDetector2
|
References & Web Resources
Most recent update: Oct. 29, 2005
|
